

The Library Health report gives you an honest, big-picture checkup of your library — how fresh your collection is, how well it's meeting demand, and how your patrons and circulation are trending. It's designed to help you make confident, evidence-based decisions about purchasing, weeding, and outreach.
While the other Insights reports are great for celebrating impact, Library Health is your behind-the-scenes management tool. It surfaces both the things that are going well and the opportunities to improve, so you can plan ahead and show stakeholders that the library is being managed thoughtfully and strategically.
You'll find the Library Health report under Insights in the main menu.
Setting your Options
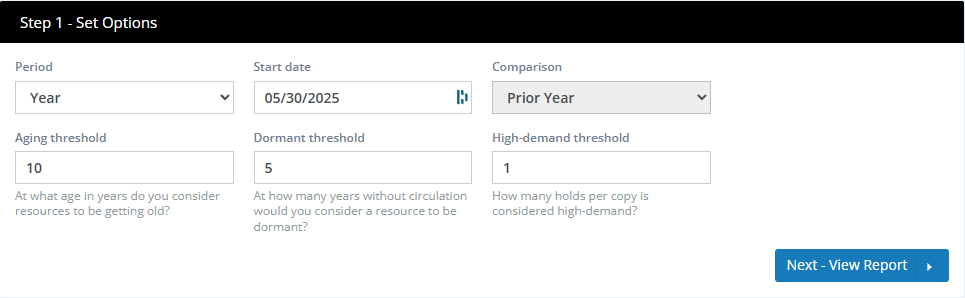
Surpass fills in sensible defaults, so you can click Next - View Report right away or fine-tune the options first. In addition to the usual period options, this report includes three thresholds that let you define what "old," "dormant," and "high-demand" mean for your library.
| Option | What it does |
|---|---|
| Period | Sets the length and type of the reporting window. Year covers a rolling 12 months; Month covers a rolling month; Calendar Month lets you pick one complete calendar month; and Calendar Year lets you pick one complete calendar year. |
| Start date | The first day of the period. For Calendar Month and Calendar Year, the date picker switches to choosing a month or year. |
| Comparison | The earlier period the report compares against. For year-length periods this is always Prior Year; for month-length periods you can choose Prior Month or the same month in the Prior Year. |
| Aging threshold | The age, in years, at which you consider a resource to be getting old. This drives the "old collection" metric and the collection age breakdown. The default is 10 years. |
| Dormant threshold | The number of years without circulation after which you'd consider a resource dormant. This drives the dormant and weed-candidate metrics. The default is 5 years. |
| High-demand threshold | The number of holds per copy at which a title is considered to be in high demand. This drives the high-demand shortages metric. The default is 1. |
Because these thresholds appear in several of the metrics and labels below, the report's wording updates to match the values you choose (for example, "Collection Over 10 Years Old" changes if you change the aging threshold).
If your data doesn't reach back far enough to fill the comparison period, the report shows the current numbers without a comparison.
Reading the Report
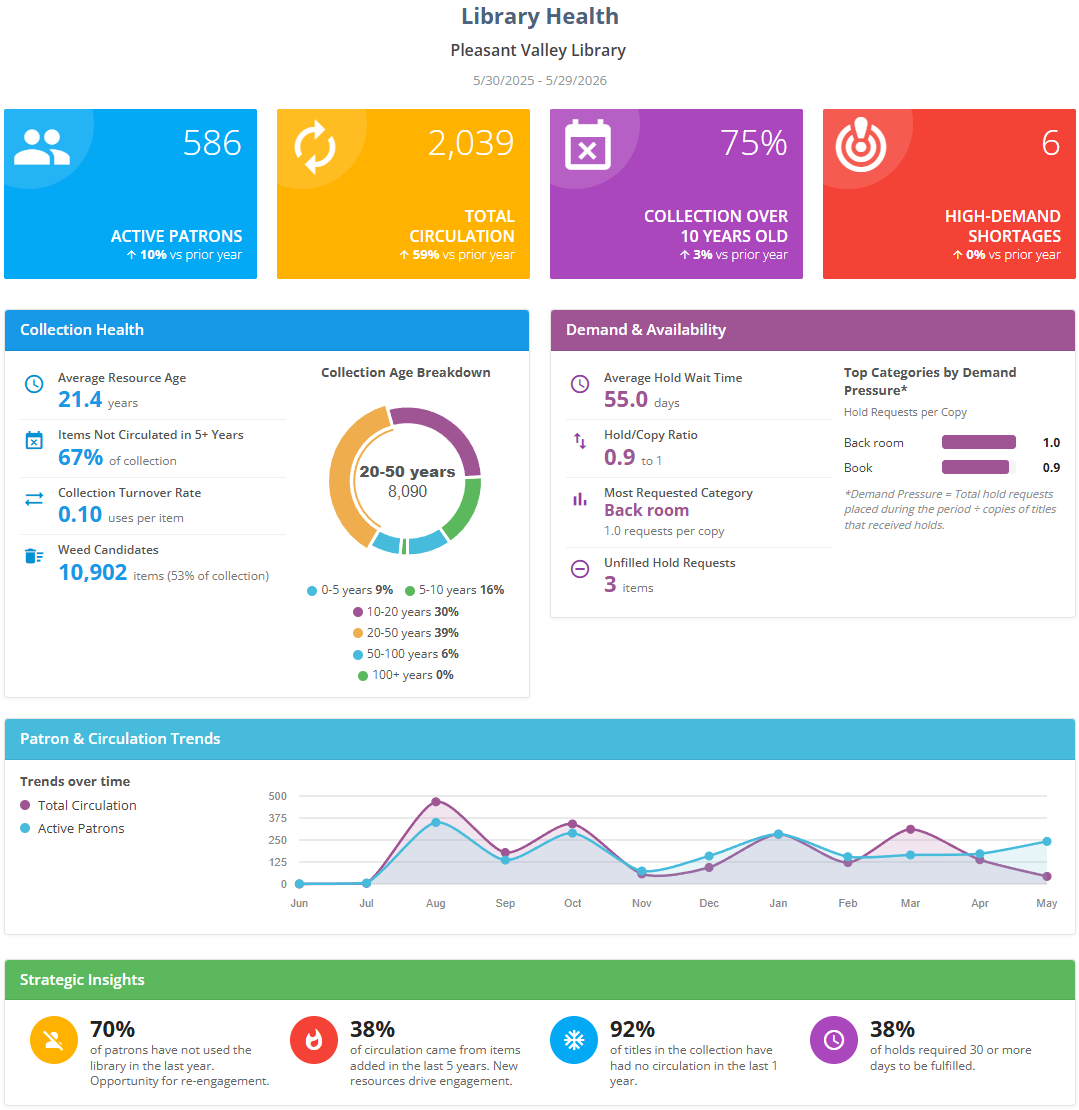
The report opens with your library's name and the date range, then presents the panels below. Numbers that can be compared with the earlier period show a small percentage with an up or down arrow.
Headline Metrics
- Active Patrons — the number of distinct patrons who had at least one tracked interaction during the period.
- Total Circulation — the total number of checkouts recorded during the period.
- Collection Over N Years Old — the percentage of items whose publication date is older than your Aging threshold.
- High-Demand Shortages — the number of titles whose holds-per-copy ratio exceeds your High-demand threshold, indicating titles with severely insufficient copies for the demand they're seeing.
Collection Health
A look at the condition and freshness of the collection:
- Average Resource Age — the mean age, in years, of items in the collection, based on each item's publication year (MARC Field 260$c) compared with the report's end date. For resources without a publication date, the purchase date or date added to the database is used.
- Items Not Circulated in N+ Years — the percentage of titles that haven't circulated within your Dormant threshold.
- Collection Turnover Rate — the average number of times each item circulated during the period (total circulation divided by the total number of items).
- Weed Candidates — items that meet the dormant threshold and have low or no demand, making them likely candidates to remove from the collection.
- Collection Age Breakdown — a donut chart grouping the collection into age bands so you can see its overall age profile at a glance.
Demand & Availability
A look at how well the collection is keeping up with what patrons want:
- Average Hold Wait Time — the average number of days between when a hold was placed and when it was fulfilled, for holds completed during the period.
- Hold/Copy Ratio — hold requests placed during the period divided by the number of copies of the titles that received holds.
- Most Requested Category — the resource category with the highest number of hold requests per available copy during the period.
- Unfilled Hold Requests — the number of hold requests still open (unfilled) at the end of the period.
- Top Categories by Demand Pressure — a bar chart ranking categories by hold requests per copy, so you can see where adding copies would relieve the most pressure.
Patron & Circulation Trends
A full-width chart that plots total circulation and active patrons over time, with a callout summarizing the overall circulation growth. It helps you see whether your library's activity is climbing, holding steady, or slipping.
Strategic Insights (the bottom row)
The bottom row of the Library Health report is a set of automatically generated Strategic Insights. The report fills four slots, and several of them adapt their wording to highlight the most meaningful window of time in your data:
- Inactive patrons — the share of patrons who had no checkouts or renewals during the prior comparison period, framed as an opportunity for re-engagement. ("Inactive" in this context is not related to patrons in the "Inactive" patron type. Those patron records are excluded from all reports).
- Circulation from new resources — the share of circulation that came from items added recently. Surpass tries windows from one to five years and reports the window that best demonstrates how new resources are driving engagement, so the label might read "in the last 1 year," "in the last 3 years," and so on.
- Titles with no circulation — the share of titles that have had no circulation activity within a recent window. Surpass tries several windows (1, 2, 5, 10, 15, and 20 years) and reports the one that reveals the largest dormant share, so the label adapts to your collection.
- Long hold wait — the share of fulfilled holds that required a long wait. Surpass chooses a day threshold (for example, 30, 21, 14, 10, 7, 5, or 3 days) that's high but still meaningful for your data, so the wording reads "required N or more days to be fulfilled." This slot is shown only when there were holds to measure during the period; if there were none, it's left off.
Because these insights are chosen from your actual data, the exact numbers, time windows, and even which highlights appear will vary from one library and period to the next.
Footer Note
A short caption beneath the report restates the comparison period in plain language.
Viewing, Printing, and Downloading
From the View Report step you can print the report or download it as a PDF using the buttons at the top of the panel. See Viewing and Printing Reports.