
The Catalog Discovery report shows how patrons find and interact with your collection through the online catalog (OPAC) — what they search for, whether those searches succeed, and which discovery features (search, browse lists, recommendations, etc.) drive title views and holds.
You'll find the Catalog Discovery report under Insights in the main menu.
Setting your Options
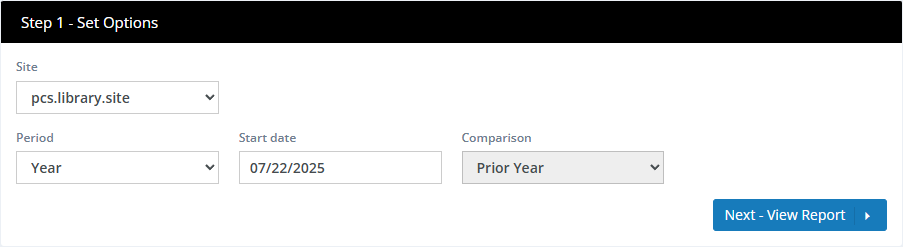
Surpass fills in sensible defaults, so you can click Next - View Report right away or adjust the options first.
| Option | What it does |
|---|---|
| Site | The OPAC configuration (site) to report on. Catalog Discovery is scoped to a single OPAC site rather than a physical location, since a site may serve one or more locations. |
| Period | Sets the length and type of the reporting window. Year covers a rolling 12 months; Month covers a rolling month; Calendar Month lets you pick one complete calendar month; and Calendar Year lets you pick one complete calendar year. |
| Start date | The first day of the period. For Calendar Month and Calendar Year, the date picker switches to choosing a month or year. |
| Comparison | The earlier period the report compares against. For year-length periods this is always Prior Year; for month-length periods you can choose Prior Month or the same month in the Prior Year. |
If your data doesn't reach back far enough to fill the comparison period, the report shows the current numbers without a comparison.
Reading the Report
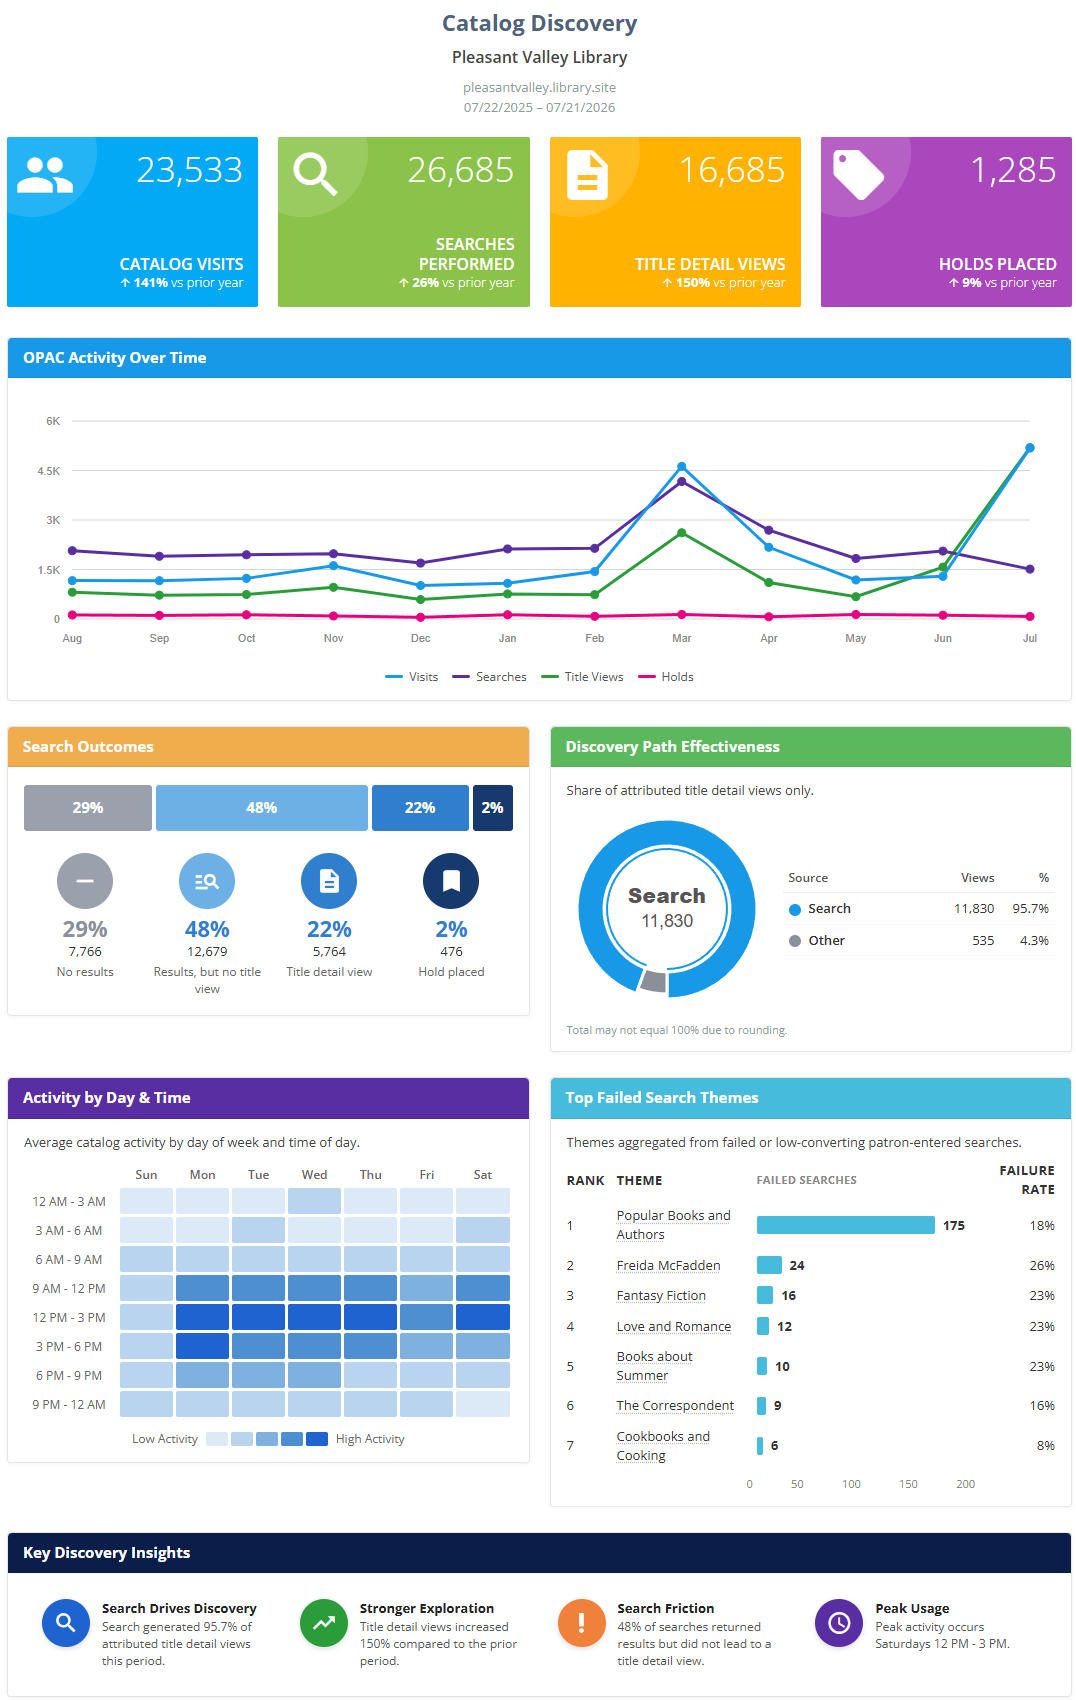
The report opens with your library's name and the date range, then presents the panels below. Numbers that can be compared with the earlier period show a small percentage (or point) change with an up or down arrow.
Headline Metrics
Four summary cards at the top of the report, each showing the total for the period and a trend percentage versus the comparison period:
| Metric | Definition |
|---|---|
| Catalog Visits | Number of times patrons opened the online catalog (OPAC) during the reporting period. |
| Searches Performed | Total number of catalog searches performed during the reporting period. |
| Title Detail Views | Number of times patrons opened a title's detail page during the reporting period. |
| Holds Placed | Number of holds patrons placed from the catalog during the reporting period. |
OPAC Activity Over Time
A 12-month line chart tracking Catalog Visits, Searches Performed, Title Detail Views, and Holds Placed side by side, so you can see how discovery activity trends over the year and spot seasonal patterns.
Search Outcomes
Shows the furthest outcome each search reached, as a share of all qualifying searches (browse-style searches from Explore lists such as New in Library, Popular Titles, and Awards & Honors are excluded, since they aren't patron-typed searches):
| Outcome | Meaning |
|---|---|
| No results | The search returned zero results. |
| Results, but no title view | The search returned results, but the patron did not open a title's detail page. |
| Title detail view | The patron opened a title's detail page from the search. |
| Hold placed | The search led to a hold being placed. |
Use this section to gauge how often patrons find what they're looking for versus hitting a dead end.
Discovery Path Effectiveness
A donut chart showing which discovery features led patrons to a title's detail page — for example Search, New in Library, Popular Titles, Explore, Recommended for You, Awards & Honors, Personal List, Bulletins, or Reviews. Paths under 5% of the total are grouped into Other. Only title views that could be attributed to a source are included; totals may not equal 100% due to rounding.
Activity by Day & Time
A heatmap showing average catalog activity by day of week and time of day, helping you identify when patrons most frequently browse and search the catalog.
Top Failed Search Themes
Groups failed or low-converting patron searches into common themes (for example, a subject or author patrons frequently search for but the catalog doesn't hold). For each theme, the report shows:
- Failed Searches — the number of zero-result searches in that theme
- Failure Rate — failed searches as a percentage of all searches in that theme
- Example Search Terms — representative search phrases, shown on hover
Use this section to identify collection gaps or cataloging issues worth investigating. If there isn't enough failed-search activity in the period to identify meaningful themes, the report displays a short explanatory message instead of this table.
Hover over a theme to see some examples of specific searches performed by patrons.
Key Discovery Insights
Four callout tiles summarizing the most notable takeaways from the report period — for example, a spike in failed searches, a shift in the top discovery path, or a change in peak activity times.
Patron Activity Over Time
A line chart of total patron activity days month by month (counting one visit per patron per day), with a short callout summarizing the trend. It shows how engagement rose and fell across the period.
Activity by Day & Time
A heatmap showing the average patron activity by day of the week and time of day. Darker cells mean busier times. Surpass automatically groups the hours into readable time bands and trims away the quiet early-morning and late-night hours, so the chart stays focused on when your patrons are actually active. This panel is a great help when planning staffing, programs, or service hours.
Tips
- Compare Search Outcomes with Top Failed Search Themes to prioritize collection development around subjects patrons are actively searching for but not finding.
- Use Discovery Path Effectiveness to evaluate whether OPAC features like Recommended for You or Explore are pulling their weight compared to plain search.
- Cross-reference Activity by Day & Time with staffing schedules to ensure support is available when patrons are most active online.
Viewing, Printing, and Downloading
From the View Report step you can print the report or download it as a PDF using the buttons at the top of the panel — handy for attaching to a board packet or annual report. See Viewing and Printing Reports.